Contour Plot for Excel v.1.01
Advertisement
Description
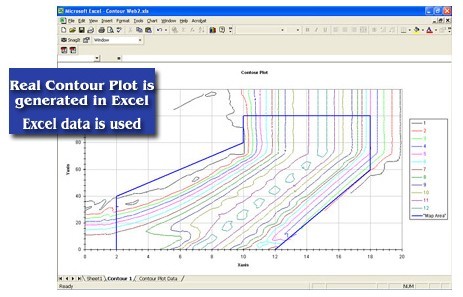
Create real contour plots in Excel using any data (rectangular, nearly rectangular, or irregular data). It includes a data generator for polynomials or any equation.
- Rate:
- Release Date:07/08/2012
- License:Shareware
- Category:Miscellaneous
- Developer:officeexpander.com
- Downloads:114
- Size:696 Kb
- Price: -
To free download a trial version of Contour Plot for Excel, click here
To visit developer homepage of Contour Plot for Excel, click here
Advertisement
System Requirements
N/A
Contour Plot for Excel v.1.01 Copyright
Shareware Junction periodically updates pricing and software information of Contour Plot for Excel v.1.01 full version from the publisher using pad file and submit from users. Software piracy is theft, Using crack, password, serial numbers, registration codes, key generators, cd key, hacks is illegal and prevent future development of Contour Plot for Excel v.1.01 Edition. Download links are directly from our publisher sites. Links Contour Plot for Excel v.1.01 from Bittorrent, mediafire.com, uploadfiles.com, hotfiles.com rapidshare.com, megaupload.com, netload.in, storage.to, depositfiles.com and other files hosting are not allowed. The download file is obtained directly from the publisher, not from any Peer to Peer file sharing applications such as Shareaza, Limewire, Kazaa, Imesh, eDonkey, eMule, Ares, BearShare, Overnet, Morpheus, BitTorrent Azureus and WinMX.
Review This Software
More Contour Plot for Excel Software
Advertisement

Financial Advisor for Excel (Full)
Borrowing, business profitability, discounted cash flows, financial planning, investing, bonds, cost of capital, options, valuation and more in this financial toolbox!!! Financial Advisor for Excel is the Swiss Army Tool of financial calculators:
FinanCal for Excel (Full Access Version)
FinanCalc for Excel is a special financial calculators toolbox for users who need to solve the most usual financial calculations directly into their Excel spreadsheets. Do you need a more powerful tool? Try Financial Advisor for Excel. NOTE:
Tools for Excel Tables
Essential tools for data analysis and tables management for novice and advanced Excel's users. A set of tools that will strengthen your Microsoft Excel to manage data bases and huge tables in your spreadsheets. Tools for Excel Tables is an addin
Consolidator Enterprise for Excel
Consolidator Enterprise for Excel is a Microsoft Excel complement especially created to consolidate a large volume of data in just a few seconds, making it possible to obtain advanced processing reports for an immediate view of the information, to serve
Picture Manager For Excel v.2.0
Picture Manager for Excel is intuitive and user friendly add-in for Microsoft Excel, designed for business users to assist in easily inserting multiple images (automatically sized to fit cells) into single or multiple Excel spreadsheets at once.
Dashboard Tools for Excel v.2.2.0
With Dashboard Tools for Excel you can use Sparklines, Heatmaps, Mini Charts, Bump charts and other special charts, getting dramatically improved data visualization for fast and effective parallel comparisons.
Recovery for Excel v.6.0.17077.1
Recovery for Excel is a data recovery software for corrupted Microsoft® Excel spreadsheets. The program supports all modern file versions including Excel 2010. It can recover images, separate rows and columns, hyperlinks, etc.
Contour Plot v.1 1
Real contour plots are created in Excel. You can interact with the contour plot just like any other Excel plot. Contour Plot works with any contour data. It accommodates rectangular data, nearly rectangular data, and irregular data.
QI Macros SPC Software for Excel v.2016-08
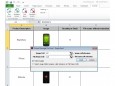
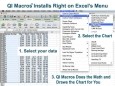
Affordable, easy to use SPC add-in for Excel draws pareto charts, control charts, histograms, box and whisker plots, scatter plots and more. Just select your data and then select a chart from QI Macros menu. Automated fishbone, statistical tests too.
Other products of this developer officeexpander.com
EZplot for Excel v.1.01
EZplot is a plotting and data calculation comput...s instead of requiring manual selection of data.
Multy_Y v.1.01
Multiple Y axes plots are created from existing ... picture that appears on a separate Excel Chart.